Figure 1.
I want to get into this quickly, so here are a few images and we can deal with the explanations and caveats afterward:
Setup
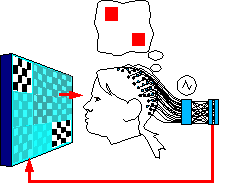
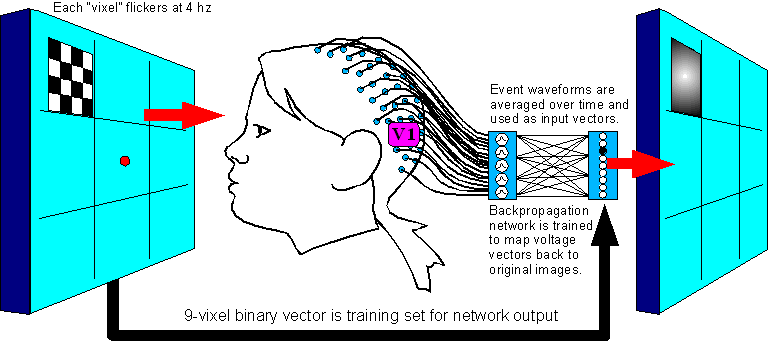
1:
Create a map from Visual Evoked
Potentials back to vision
Figure
1.
Setup
1 steps are:
1. Flash each
stimulation image 500 times, shuffled in random order with the other
images.
2. Take event-triggered
averages of the data to establish a signature voltage vector for each
vixel.
3. Train the network to map
each image's signature vector back to the 1-vixel image that
generated it.
...And then on to Setup
2 or Alternate
Setup 3. But first, let's fill in some details:
"Vixel"?
Pixel = "picture element", voxel = "volume element", so vixel = "visual field element". For the time being, I just need a word distinct from "pixel" to describe the resolution of a visual stimulation pattern. It refers to any compact, contiguous subarea of a person's visual field that is stimulated as a unit. A vixel may be round or angular, large or small, and adjacent vixels may be touching or widely spaced.
What is the neural network program classifying?
|
These, more or less, although I plan to use 9 rather than 4: |
|||||||
|
Stimulation
of |
Stimulation
of |
Stimulation
of |
Stimulation
of |
||||
|
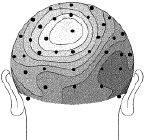
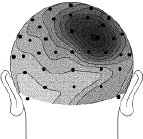
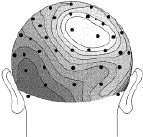
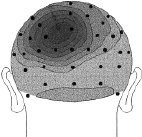
Figure 2 (above). Clipped from Cortical Sources of the Early Components of the Visual Evoked Potential, by Francesco Di Russo, et al. 2001. |
|||||||
|
Each head in Figure 2 represents the average electrical field produced by primary visual cortex, under VEP stimulation of a different quadrant of a person's visual field (stimulation regions shown in Figure 3 at right). Scalp voltages in Figure 2 range about -1.5mv to +1.5mv, dark being positive. The averages are taken over hundreds of VEP events. These pictures are clipped from Cortical Sources of the Early Components of the Visual Evoked Potential 11, which is important to this page and referenced often here. At any time I mention working with archival VEP data, it is DiRusso's data. I borrow their excellent graphics for illustrative purposes. |
|
||||||
Figure 4. The stimulation images I plan to present (9 vixels plus two baselines). Each of these will be each be contrast-inverted 500 times, in random order, and the VEP signature vectors recorded from the scalp and averaged (for each position separately).
|
|
|
|
|
|
|
|
|
|
|
|
|
baseline 0 |
|
|
|
|
|
|
|
|
|
baseline all |
Can a neural network program really classify VEPs? Looks like magic thinking.
The neural network is in fact the most bird-in-hand part of the system to date. I have written the network code and tested it on DiRusso's archival VEP data with 400% artifical noise added in, and in a single 16-millisecond-long data-timestep the network decodes the voltages back to the origional 4-vixel visual image with 95% accuracy. (There are already other ways 6,7 to classify VEPs in realtime, so this is plausible.)
Key
Point:![]() Each vixel's signature vector is not only distinct from the others,
it is also linearly distinct. This means that even when the
electrical fields produced by two or more vixels are added together,
the resultant vector can still be decoded into the original
combination of vixels that created it. Whenever I tested my network,
I required it to distinguish every possible combination of vixels
from every other combination, not just one vixel from another.
Each vixel's signature vector is not only distinct from the others,
it is also linearly distinct. This means that even when the
electrical fields produced by two or more vixels are added together,
the resultant vector can still be decoded into the original
combination of vixels that created it. Whenever I tested my network,
I required it to distinguish every possible combination of vixels
from every other combination, not just one vixel from another.
As a bonus, we can also milk VEP data for even faster and more accurate classification.
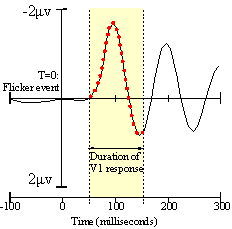
The noise-filtering power of a neural network increases with the size of its input vector. A large number of EEG channels is ideal, but we can also collect many more data points from each electrode, by breaking down the curve of each single VEP event through its 100ms (V1 activity) timespan. For example, DiRusso's data used a 62-channel EEG taking samples at 250 potentials per second, so if we used all 25 data points per channel our network would have a 1550-dimension input vector. When I did this with DiRusso's archival data, I could add 10 times as much noise as signal and the network still classified it accurately 95% of the time.
|
|
Figure 5. A VEP curve of a single typical electrode, hand-traced from Cortical Sources of the Early Components of the Visual Evoked Potential, by Francesco Di Russo, et al. I added the 25 red dots, removed a superimposed plot from another EEG channel and highlighted the V1 response time period. |
What about the low VEP signal-to-noise ratio?
I haven't been able to find out directly what the average signal-to-noise ratio is for VEPs, but I do know that DiRusso and co. averaged together 1,400 flickers per quadrant of visual field and got good results. So if we assume they wanted their output data to be at least 95% accurate, then the level of input noise that would justify averaging 1,400 samples is about 2 times the amplitude of the VEP signal itself, i.e. signal-to-noise ratio is 1:2. I arrived at this ratio empirically by writing a program that gradually increased input noise, then averaged it out 1,400 times on each iteration, until the output error grew to 5%. It was a brutal technique but I trust it at least within a factor of 4.
When I added 200% artificial noise to DiRusso's real 62-channel VEP data, it took 3 time slices (each 4ms apart) per VEP for the network to classify the data correctly 97% of the time. Therefore realtime classification of VEPs by neural network seems very much within reach.
What about saccades?
Most
VEP studies simply require the subject to stare at a dot in the
middle of the screen, which usually works fine, but can be very
tiring for the subject. A possible alternative is to constantly move
the stimulation patterns to the center of the subject's gaze. To do
this, we would use an eye-tracking system, many of which are
available commercially off-the-shelf these days:
Eyegaze
Systems
MyTobii
eye control system
Video
Eyetracker Toolbox
Quick
Glance, by EyeTech Digital Systems:
EyeLink
II (head
mounted)
GazeTracker
...And many more if
you google for "eye tracker". Most are pretty expensive
though (US$3,000 - $20,000!) so unless someone gives me a lot of
money I'll be staring at a dot.
Setup
2:
Decode the effect of visualization on the VEP signal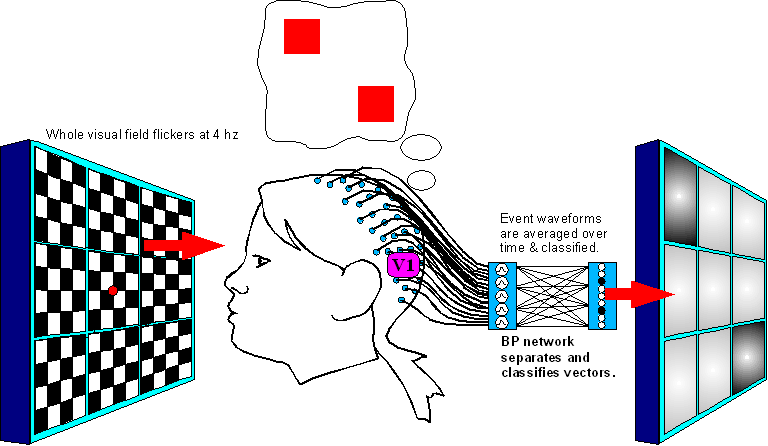
Figure
6.(Electrodes are not moved from Setup 1.)
Setup
2 steps are:
1. Generate a random combination pattern of
vixels, present it to the subject for her to imagine it.
2. Blank
the image for 1 second to clear persistance of vision.
3. Present
all contrast-inverting vixels at once for several seconds while the
subject visualizes the required image.
4. Record the EEG data, go
to step 1 and repeat for many different 1-vixel and multi-vixel
patterns.
5. After recording, take event-triggered averages of the
VEPs and subtract the “baseline all” scalp vector out of
them.
6. Run the averaged & adjusted VEPs through the
classifying network and see if the results correlate significantly
with the pattterns the subject was asked to imagine.
Figure
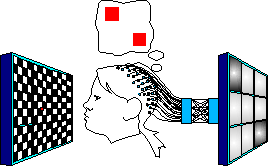
7.a-c. A typical presentation cycle would be:
|
Suggest
|
Pause-Clear
|
|
|---|---|---|
|
Image to visualize is presented for 1 second. |
Pause 1 second to clear persistence of vision. |
Subject is asked to visualize image intensely while watching full flickering screen. Data is gathered during this phase. |
|
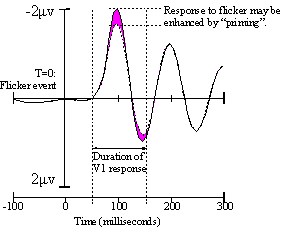
Figure 8. After Di Russo. A hypothetical modulation of one EEG channel. |
The way it works: input from higher cortex is expected to "piggyback" onto the 4hz beat we send through V1, making it more detectable in the event-flagged VEP data. This is due to temporal and spatial summation; any excitatory signals trickling from higher cortex to regions of V1 should prime those regions to fire earlier, and more strongly, at the beginning of every evoked potential. There are precidents for this type of modulation 9,10. |
|
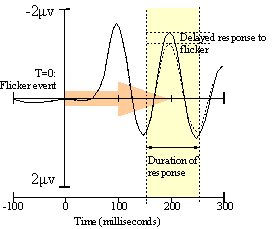
A caveat: there is some evidence10 that top-down priming of V1 may occur about 100 milliseconds later than the initial V1 response to the sensory flicker event. If this is true, we will have to adjust the experiment to classify more latent electrical fields, or even those originating from V2 if necessary. The basic principle does not change, although the more latent our waveforms are, the more likely our vixel signature vectors will reflect nonlinear interactions with each other inside the brain. Coping with nonlinearity is not a show-stopper but it does require a lot more work; we will have to perform Setup 1 with many simultaneous combinations of vixels and train the network to classify them as groups rather than just individuals. |
Figure 9. After Di Russo. |
Amplify the effect with realtime feedback
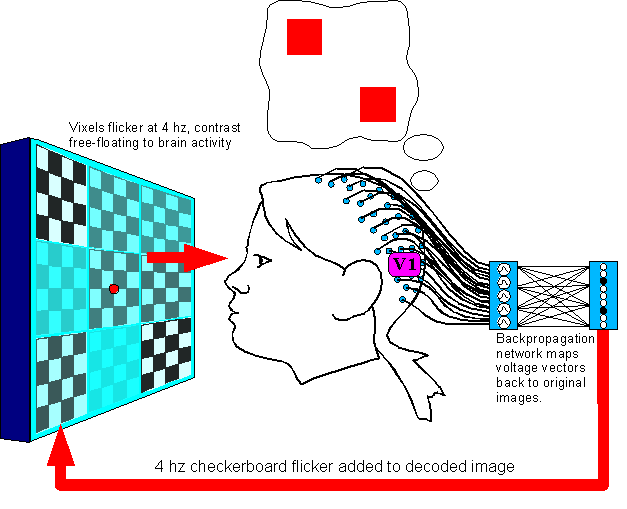
Figure 10.(Electrodes are not moved from Setup 1.)
Setup
3 steps are:
1. Generate a random combination pattern of
vixels, present it to the subject for her to imagine it.
2. Blank
the image for 1 second to clear persistance of vision.
3. Present
all vixels at half-contrast, flickering at 4 hz.
4. Decode the EEG
event waveforms into the original image in realtime, and display the
decoded image back to the subject on the presentation screen.
5.
Record all states of the presentation screen until the image ceases
to change.
6. Go to Step 1 and repeat for a wide variety of
vixel patterns.
The
reason for this arrangement: The feedback loop is to “float”
the values of the vixels, so that any bias introduced into the signal
by higher cortex will have an iterative (and exaggerated) influence
on the image as it loops around.
Figure 11.a-c. A typical presentation cycle would be:
|
Suggest
|
Clear-Initialize
|
|
|---|---|---|
|
Image to visualize is presented for 1 second. |
Screen is initialized to noncommittal half-contrast 4hz-flicker. |
Subject is asked to visualize image intensely while viewing her own realtime-decoded brain output . Each iteration of the looped signal compounds the effect of top-down brain activity on V1. |
...And then of course record the data from the loop.
What resolution of visual field can VEPs discriminate? Even if this works, are we forever limited to 4 vixels?
I haven't been able to get a final answer on this, but I do have some hopeful estimates. My first source on VEP resolution is
this paper by Dr. Vincent Clark. In particular, look at pages 173 and 179. At least 20 postions of visual
field, all confined to a ring, produced unique potential vectors. I don't have the data, but they may even be linearly independent.
My second source is a brief conversation with Dr. Alan Gevins at the San Francisco Brain Research Institute. His reply was:
"Hi John -- Thanks for your question. I'm sorry I do not know the answer based on data from my lab.
I passed your message on to a colleague, Greg Simpson at UCSF who may have more experience with VEP mapping.
In part the discriminability of two points in the visual field from a scalp VEP will depend on: 1) the intensity of the stimuli
and the number of stimuli averaged or otherwise grouped per location; and 2) the density of spatial sampling at the scalp and the
signal processing used to distinguish the responses. I'd hazard a guess that if the above considerations were optimized, a difference
of a degree or two from the center of fixation may be the limit. If the flicker was at different frequencies, finer resolution could be obtained.
Greg Simpson's reply was in agreement but no more specific...
For proof-of-concept alone though, a resolution of only 4 positions as in Di Russo's work would be OK. It would at least justify better studies down the road.
Best of luck,
-Alan Gevins"
|
|
September 30 2005 |